Measuring Prosody Diversity in Zero-Shot TTS: A New Metric, Benchmark, and Exploration
Contents
DS-WED Metric
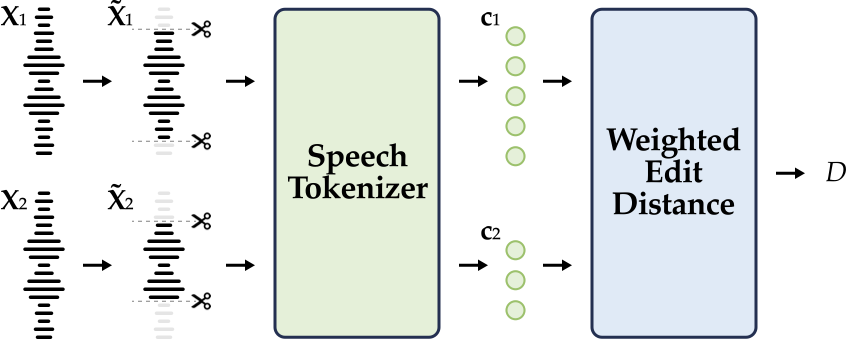
We reinterpret the weighted edit distance as the minimum perceptually prosodic modifications required to transform one speech into another at the discrete level for audio samples synthesized by the same system, using the same text and the same speaker.
Comparison of DS-WED and Acoustic Metrics with Human Ratings
PMOS exhibits the strongest correlation with DS-WED, followed by MCD. The correlation with log F0 RMSE is weaker, suggesting that pitch deviations contribute to perceived differences but account for only part of the variability in pitch, neglecting rhythm, intensity, and duration.
| Sample A | Sample B | log F0 RMSE | MCD | DS-WED | PMOS | |
|---|---|---|---|---|---|---|
| Group 1 | 0.330 | 6.433 | 101 | 3 | ||
| 0.220 | 6.157 | 263 | 5 | |||
| Group 2 | 0.141 | 3.259 | 123 | 1 | ||
| 0.138 | 4.047 | 168 | 3 | |||
| Group 3 | 0.352 | 4.052 | 145 | 2 | ||
| 0.261 | 4.591 | 204 | 5 |